
Severe Weather 101: Hodograph Basics
This is the thing I get the most questions about. This incredibly useful tool might as well be Greek to the average lay-person. So, I want to demystify it.
In this post I’m going to lay out the basics of how a hodograph is constructed.
- Wind Barbs
- Wind As A Vector
- Polar Coordinates
- The Polar Plot
- Constructing a Hodograph
When you pull up weather balloon data, you’ll see wind barbs next to the plot showing temperatures of the atmosphere. The wind barbs tell you how strong the wind is, and what direction it is blowing from. Below I have a sounding from Jackson, MS on 4/13/22 at 20z and I highlighted the wind barbs.

Polar Coordinates And Wind as a Vector
A vector is simply something with a magnitude (in our case, speed of the wind) and direction.
We convert them to polar coordinates, which is done to greatly simplify the direction piece. If using traditional cartesian coordinates (x,y) we would need to account for the east/west magnitude and the north/south magnitude. Sure wind out of one cardinal direction would be easy, but a wind out of the NW would require doing some math to figure out what parts are from the x and what parts are from the y.
Translating to polar coordinates eliminates the need. We just need the wind speed and what direction is out of in degrees. So 20 kts out of the south would be (20, 180 degrees).
That does mean using a different kind of plot compared to your typical x,y plane. This plot is a circle with different radiuses from the center representing magnitude (wind speed) and different spokes in the circle representing angles. Check out the drawn up polar plot below.

Poor drawing aside, this gives you the idea. North is 0. East is 90. South is 180. West is 270.
Hodograph Conventions
There’s only one weird tick to the hodograph, and it is that the direction is based on the direction the wind is Blowing Toward. So it’s 180 degrees from the direction reported by the weather balloon, which is the direction the wind is Blowing From.
Simple enough, let’s see it in action. I’m going to use 20 kts from the south as my example vector.

Construction of Hodograph
Now that you have the idea of how vectors get plotted into our plot, I’m going to build a hodograph. The only changes I’m making is each ring within the plot will correspond to 10 kt vs every two rings per 10 kt.
This will be made with wind values I make up, for ease of seeing certain things. The first vector will be a surface wind and each one thereafter will be for one kilometer up from the last one. So we go surface, 1 km, 2 km, 3 km, and so on up to 6 km. I’m going to do it in steps, so you can see the process better. Once completed, I’ll connect the tips of the arrows with lines and then remove the arrows which will leave the familiar plot of a hodograph. Once that is complete, I’ll talk briefly about what those lines actually represent.

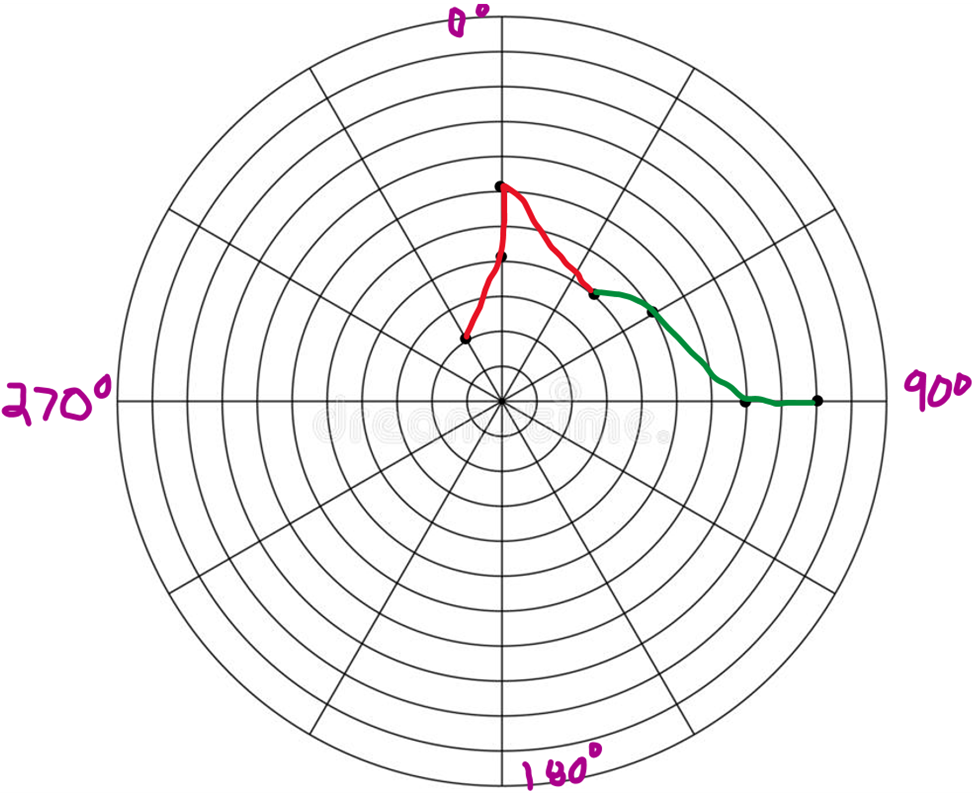
I’m using a surface wind from the SSE at 20 kts and a 1 km wind from the due south at 40 kts in this example. The red line represents the surface based wind and the green line represents the 1 km wind. I put dots at the head of the arrows, since these are the spots I will be connecting to create the hodograph plot. Now I’m going to add the 2 km and 3 km winds. I’m going to have a 2 km wind out of the south once again, except it will be 50 kts and a 3 km wind out of the SW at 40 kts.

That’s the 2 km wind, 60 kt from the south, in purple. The 3 km wind, 40 kt from the SW, is in blue. Once again, I put dots at the head of the arrows. I’m now going to add three more vectors to the plot.
The 4 km wind, which will be 50 kts from the WSW. The 5 km wind which will be 70 kts from the west. Finally the 6 km wind which will be 90 kts from the west.

So now all the vectors are plotted. I have the 4 km wind in orange, pointing from the WSW at 50 kts. The 5 km wind is in pink, pointing from the west at 70 kts. Finally, I have the 6 km wind, pointing from the west at 90 kts in light blue. The next step is going to be to take the vectors away, just leaving the points and drawing a line to connect those points. I’m going to use red to connect surface through 3 km and green to connect 3 km through 6 km. This is to differentiate “low level” and “mid level” flow.
This is not the most realistic windfield ever conceived, but I think it is a good way to illustrate a few things.

Look at that! Looks like a hodograph to me.
That’s all it really is, just a line connecting the heads of our arrows. To remind you, the heads of the arrows are the strength of the wind (magnitude) and the direction the wind is blowing toward (angle).
Now would be a good time to review the Severe Weather 101 On Shear. That is because, those lines are actually the shear vectors between different levels of the atmosphere. The line connecting the surface to 1 km gives you the magnitude and direction of the shear at that level! Same for the line connection 4 km and 5 km. Even better than that, we can find shear between any level by simply drawing a line from the lowest point to the point of interest. The length of the line gives you the magnitude of the shear!
Of course, to actually get the values of the shear, you have to convert the polar vectors back into cartesian vectors (x, y) and do the vector subtraction. Then convert back to polar coordinates. Yes, a pain, but that’s why computers exist…to do the math we don’t want to (or can’t in a reasonable amount of time). I’m not going to go through the math, just want you to know that’s how it is done to get those different shear values.
That’s all I think should be covered in this post. I want you to see the basics of how a hodograph is constructed and have a general idea of the physical meaning of those lines. In the next Severe 101 post, I’m going to dig in deeper on the hodograph. I’ll discuss how speed and directional shear can easily be seen on the hodograph, what some common shapes of hodographs tell you, and even get into some details of seeing streamwise vs crosswise vorticity from the hodograph.
Looking forward to seeing you back!
Related Posts

Hurricane Season 2023 Preview: El Nino Returns
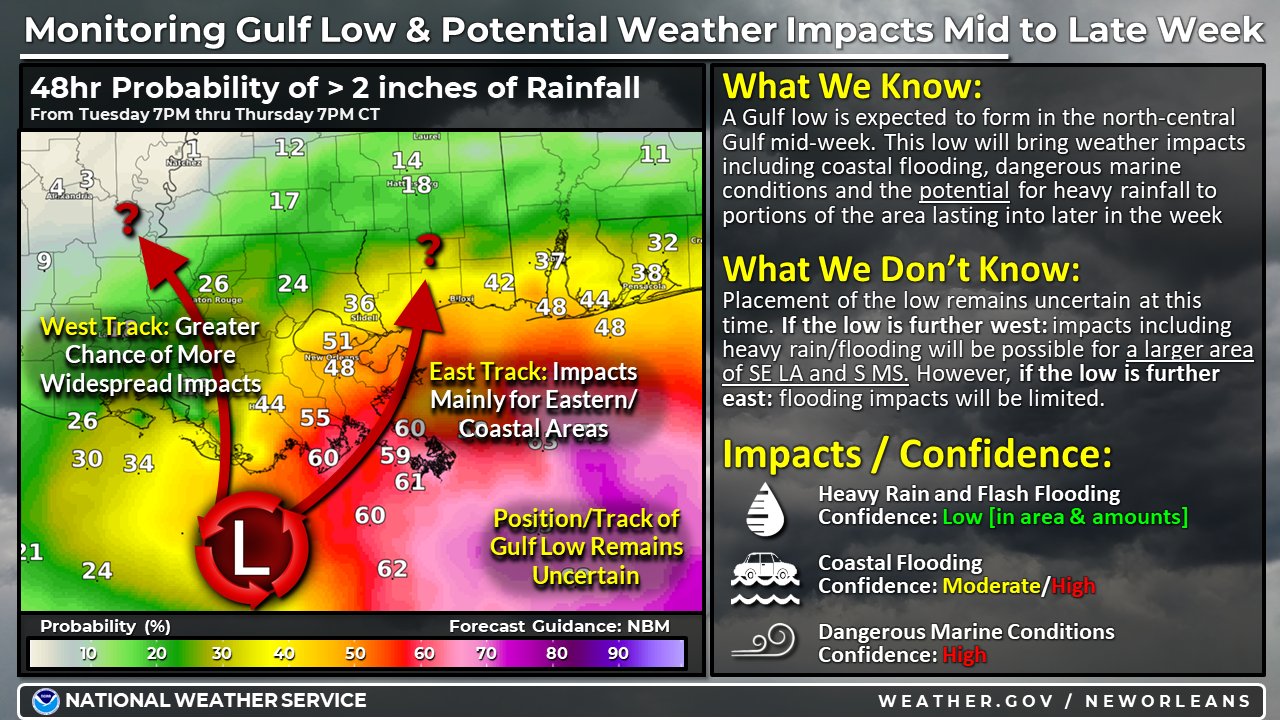
Gulf Low Will Bring Rain and Coastal Flooding
One For The Mardi Gras Skiers

Bust Out The Shorts For Mardi Gras
Hope You’ve Enjoyed Fall So Far. Looking Ahead At The Big Picture Into November.
The Media Coverage Of Ian Has Been Frustrating
Hurricane Ian To Make Second Landfall In Carolinas
Hurricane Ian Strengthens and Grows Larger With Landfall Tomorrow
NHC Forecasting Near Nightmare Scenario For Tampa
One thought on “Severe Weather 101: Hodograph Basics”
Comments are closed.