
Hodographs Part 2 – Shear and Storm Motion
The Rundown
In this post I’m going to go over some of the things meteorologists can figure out from the hodograph, and hopefully give you the tools to do some of the safe on your own. You know, if hodographs are something you want to spend your free time on. Refer back to Part 1: Hodograph Basics if you want to see how these powerful charts are constructed.
In Part 2 of The Hodograph 101, I’m going to discuss:
- Finding Important Shear Layers using Hodographs
- Determining Storm Motion
- Hodograph Shapes
- Left Moving/Right Moving Storms
Ready? Let’s jump in.
Finding Shear With The Hodograph
For the examples in the rest of this post I’m going to use a hodograph from an observed upper air sounding. The site was Davenport, IA on 4/12/22 at 18z. It is a classic high shear environment, perfect for drawing all over to illustrate things.
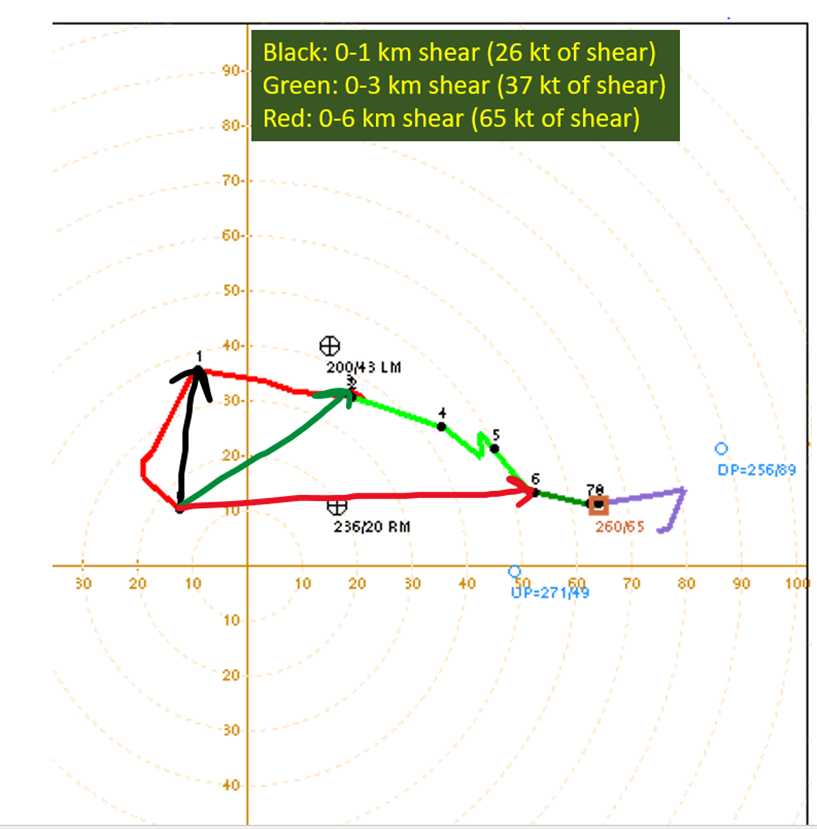
First up, I’ve drawn the shear vectors at three different levels.
- Colored black, shear from the surface to 1 km above the ground.
- In green, shear from the surface to 3 km above the ground.
- In red, shear from the surface to 6 km above the ground.

The first thing that should stand out is just how simple this process is. All that I did was draw an arrow from the lowest level of interest (in this case, the surface) to the higher level of interest (1 km, 3 km, 6 km respectively). The length of the arrow tells you the magnitude and the direction tells you…well, the direction.
If you pull a sounding from the SPC Soundings all of these values will be calculated in the background and displayed in the box for shear. I’ll highlight that box in the image below.

Storm Motion
This section will be to show you how you can estimate storm motion with a hodograph. Remember this is an estimation and without using the power of a computer. In reality, I would use a computer with calculate the storm motion using something like Bunker’s Method. The central idea in determination of storm motion with a hodograph is still useful without a computer. That idea is the average storm motion is determined by the environmental wind field, assuming no external forcing.
Examples of external forcing being cold fronts, outflow boundaries, outflow from a convective complex of storms.
Using the Mean Wind To Estimate Motion
First of all, we want to see what the mean environmental wind looks like. For that, I’m going to break the wind down into it’s two horizontal components. The bottom line will be the east/west wind, with the hodograph dictating the top line. In the drawing I’m going to show you below, I’ve got orange arrows going up from the bottom line to the hodograph to show that is considering the north/south wind. The process from that point is simple. I’m going to estimate a mid-point and draw an arrow from the origin to that point.
That arrow will be the (rough) estimate of mean storm motion.

I normally would just let the computer figure this out for me, using math to give a more rigorous estimate of storm motion. This is just to give you the basic idea visually how how it would work.
Seeing this, you might be thinking that looks almost exactly in-between the RM and LM points on that plot. You would also be right. Those points are for deviant right and left moving storms, which I will discuss at the end. Before we can discuss deviant motion, I think it is useful to discuss different shapes of hodographs.
Hodograph Shapes
This is going to cover two basic shapes we commonly see when doing severe storm forecast:
- Straight Hodographs
- Clockwise Curved Hodographs

Straight Hodographs – Vortex On The Flanks
A mostly straight hodograph shape makes for likely cell splits and deviant motion, but left and right movers are equally favored. As the storm moves along the mean wind and matures, a straight hodograph shear profile will lead to having rotations and vertical motion along the flank of the cell. These rotations mature and cells split with one going right and the other going left. The spin within the cells will be different too, with a left mover having a spin opposite of the right mover.
They’re basically mirror images.

The physics behind this I will address in a later post. Right now I’m just pointing out this is a phenomena that happens.
Clockwise Curved: Right Mover Favored
With a clockwise curving hodograph, similar to the Davenport example I’ve been using, a right moving supercell is favored once it matures. Within a storm in a sheared environment, you get relative high pressure regions on the upshear side at a given height level and relative low pressure regions on the downshear side at a given height. When you have a shear profile that produces a clockwise curving hodograph, you get an area of relative high pressure near the surface on the southside and relative low pressure aloft on the southside.
This makes for extra rising motion, since air is going to move from high to low pressure. On the north side of the storm, you get the opposite. A relative low pressure near the surface and relative high pressure aloft. This makes the air on the northside tend to sink, slowing and stopping the convection.

I’m also going to post Cameron’s video on “How To Hodograph” at the bottom of the page, since his work on hodographs is what inspired me to do this series and learn more myself about just how useful the hodograph is!
The tl;dr version:

In this edition of Severe 101, I went over to how to find shear at different levels using the hodograph. This is a good time to remind you that the lines of the hodograph also represent shear between levels. Then I discussed how to do a quick estimation of mean storm motion using the hodograph, though I would advise using computer programs to make better estimations. That’s what runs in the background of those SPC soundings to determine storm motions. After that, I told you about general hodograph shapes and how those give insights into if left or right deviant motions are favored. That seems like a good place to take a pause.
In the next hodograph post, I’m going to dig into what Storm Relative Helicity is. In addition, I’ll discuss streamwise and crosswise vorticity. What those terms mean, how to see them on the hodograph, and what they mean for deviant cell motions.
That’s all for now.
For those who want more hodograph content though, check out the youtube video below and give CameronJNixon a follow on twitter.