April 27, 2011 – Top Down Analysis
There are dates that any student of weather history will instantly recognize.
April 27th is one of those legendary and tragic days.
Eleven years ago, the most prolific tornado outbreak on record rampaged across the Southeast with an astounding 292 tornado reports produced on this single day. Alabama and Mississippi caught the worst of it. By the end of the outbreak, 348 people were killed and 253 of those in Alabama. Remember them this week.
Today, I’m going to do a top-down breakdown of 4/27/11 and highlight the features that produced a tornado outbreak that will be talked about for generations in the locations that experienced it.

I’m going to break the set up down into three parts for you:
Then I’m going to show the legendary Birmingham upper air sounding from 7 pm that night and break it down in detail.
Evolution of the Upper Levels
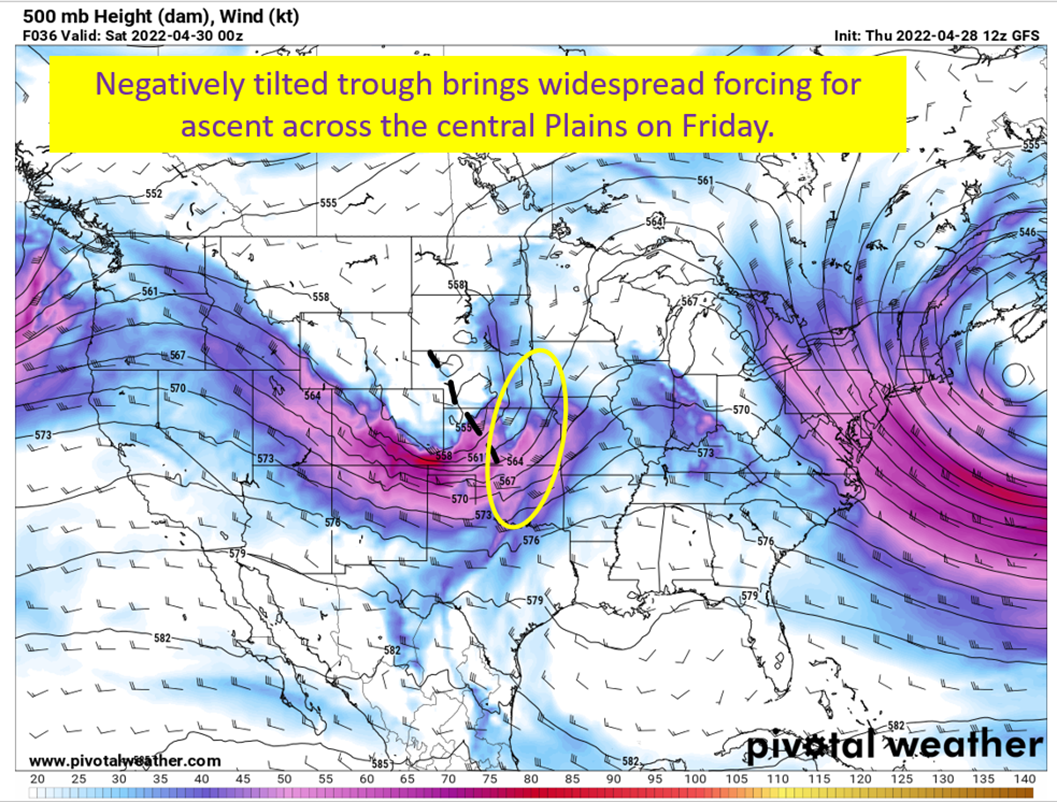
The upper air pattern by 7 pm on 4/27 implies just how volatile the atmosphere was that day over Alabama and Mississippi. They were positioned just right along the jet stream to have substantial upper level divergence overhead, which supports air moving upward. At the 500 mb level a strong shortwave took on a negative tilt (negative tilts typically yield severe weather) with the base of the trough swinging in toward Memphis putting AL/MS is an extremely favorable position for lifting.
Honestly, all I would need to see was that 500 mb chart and know it was late spring to go “well that would be very bad”. I’ll get to that in a minute, but first the jet stream level. This was at 7 pm central on 4/27/11. THIS IS NOT CURRENT OR FORECAST!!

I’ve seen more obvious divergence aloft before but this is substantial. This provided ample forcing for a surface low just to the north in roughly western Kentucky, but also lift all throughout the highlighted region. It’s both divergence and diffluence here working together. The divergence being those stronger winds going to weaker winds and the diffluence is the splitting direction. This together is favorable for severe thunderstorms, which is unsurprising to see knowing what happened on 4/27.
500 mb: Negative Tilt

Sometimes it is just obvious.
Trough takes on a negative tilt by evening, and swings the base into the Mid-South. This brings height falls (cooling aloft basically) and a punch of stronger winds at 500 mb to increase the bulk shear just that much more. This is also supportive of surface low forming just to the north (it was there, as you’ll see in the surface analysis). The other thing that stands out is it wasn’t some gigantic trough and didn’t overrun the area with too much forcing. Those cases can lead to a lot of storms going up quickly and competing. This positioning was just right to produce numerous supercells.
Increased shear and cooling aloft are what you would ask for to create severe storms. All this with enough forcing for vertical motion but not too much.
Lower Levels – Warm Air Advection + Strong Low Level Jet
At the 700 mb level, the warm air advection regime was apparent across Alabama/Tennessee/Kentucky. The chart, shown below, is from 7 pm central on 4/27/11, so it misses the action in Mississippi that day. Just remember, it was happening there too through the afternoon, it just you get two snapshots of the upper air patterns at 7 am/7 pm central every day.
Warm air advection supports vertical motion is why I like to look for it and the 700 mb level is the typical place to look when doing this kind of analysis.

Low Level Jet Bringing Home The Tornado Risk

It is not a surprise a strong low level jet was present. Over in Mississippi, you can see the 850 mb front push in. Note the tightly spaced red dotted lines (lines of equivalent temperature) and green lines (lines of equivalent dew point). Out ahead of it, there are strong winds roaring out of the south and this sort of low level jet suggests extremely high levels of low level shear. Unfortunately on April 27th, the high end danger of this was realized.
The gist is, at this point, we had everything above the surface working in favor of severe storms and tornadoes. Unsurprisingly, the surface level was also primed for violent storms.
Surface: Pressure Falls and An “Effective Warm Front”
I pulled a surface analysis from the WPC from 4 pm central on 4/27/11 to illustrate a few of things happening. This chart is a little messy, with surface obs getting in the way of the important bits of the plot. Still, it helps finish the story. What you see is a reasonably strong surface low of about 992 mb moving through the bootheel of Missouri. That’s where all the best forcing for ascent was, and the strongest thermal gradient at the surface. That’s where low pressures will be.
As the low moved east, you had pressure falling ahead of it and to the south. Pressure falls show more rising air and thunderstorm potential. In addition, thanks to the clouds breaking you had significant warming at the surface in Alabama and Mississippi. This made what was in practice a warm front between the areas with more cloud cover and those that cleared. That acted as another boundary for storms to root into and follow as well as set the edge for an open warm sector with high dew points and temperatures well into the 80s.

At this point, we have all the ingredients for a tornado outbreak over Mississippi and Alabama. Convergence at the surface, divergence aloft, warm air advection, and increasing advection of vorticity aloft. All a bunch of fancy words to say: “there’s a lot of lift here”. In addition, you can tell just by looking at the direction of the wind barbs over all the levels posted above there would be plenty of shear to organize storms into supercells. Finally, dew points in the mid 70s and temperatures in the 80s on the above surface analysis suggest abundant instability for convection.
This brings me to the Birmingham upper air sounding at 7 pm central on 4/27/11.
The Legendary BMX Sounding on 4/27/11

The above sounding, and a bunch of other information about 4/27 can be found here.
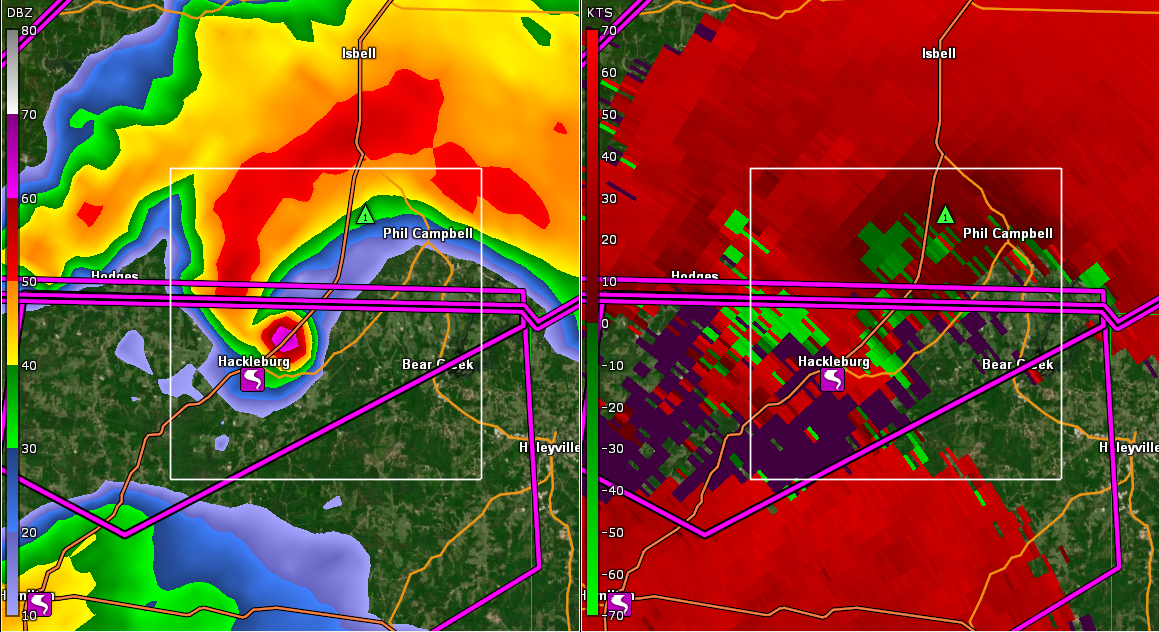
This is simply a scary environment for storms to be in. Extremely high low level shear in place, with incredible amounts of SRH for right moving supercells to ingest. Simply explained, the SRH is rotating horizontally and the storm picks it up and tilts it vertically. In other words, there’s a ton of spin for the updrafts and that is favorable for tornadoes.
On top of that, you had very supportive lapse rates (decrease in temperature as you go up) and the expected high instability from the warm surface and cooling aloft. Then, the cherry on top is the deep layer shear that is very supportive of supercells. Couple that with the storm relative winds between 4-6 km in the sweet spot for those classic hook echo’d supercells and this is frightening!
The Anatomy of a Tornado Outbreak

This event had high end parameters at every single level come together to produce what can only be described as a “Super Outbreak”. In the state of Alabama alone there were 11 violent (EF4 or EF5) tornadoes on this single day! Since 2000, there have been 9 EF5 tornadoes in the United States. Four of those were on 4/27/11 and three of the four were in Alabama. That’s a third of all EF5s in the last 22 years, in one day in one state.
In the above explanation, you can see how the upper levels + low levels + surface level conditions were all aligned to create a nearly perfect environment for tornadoes. Not something I ever want to see again.
Tomorrow, I’m going to have another post on 4/27. It won’t be a technical breakdown of anything, just to look at the stories of people who survived and the forecasters who put out the dire warnings at the event unfolded.